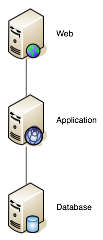
Suppose you build a web site out of a single stack of one web, app, and database server. What sort of availability SLA should you be willing to support for this site?
We'll approach this in a few steps. For the first cut, you'd say that the appropriate SLA is just the expected availability of the site. Availability is defined in different ways depending on when and how you expect to measure it, but for the time being, we'll say that availability is the probability of getting an HTTP response when you submit a request. This is the instantaneous availability.
What is the probability of getting a response from the web server? Assuming that every request goes through all three layers, then the probability of a response is the probability that all three components are working. That is:
![]()
This follows our intuition pretty closely. Since any of the three servers can go down, and any one server down takes down the site, we'd expect to just multiply the probabilities together. But what should we use for the reliability of the individual boxes? We haven't done a test to failure or life cycle test on our vendor's hardware. In fact, if our vendor has any MTBF data, they're keeping it pretty quiet.
We can spend some time hunting down server reliability data later. For now, let's just try to estimate it. In fact, let's estimate widely enough that we can be 90% confident that the true value is within our range. This will give us some pretty wide ranges, but that's OK... we haven't dug up much data yet, so there should be a lot of uncertainty. Uncertainty isn't a show stopper, and it isn't an excuse for inaction. It just means there are things we don't yet know. If we can quantify our uncertainty, then we can still make meaningful decisions. (And some of those decisions may be to go study something to reduce the uncertainty!)
Even cheap hardware is getting pretty reliable. Would you expect every server to fail once a year? Probably not. It's less frequent than that. One out of the three servers fail every two years? Seems to be a little pessimistic, but not impossible. Let's start there. If every server fails once every two years, at a constant rate [1], then we can say that the lower bound on server reliability is 60.6%. Would we expect all of these servers to run for five years straight without a failure? Possible, but unlikely. Let's use one failure over five years as our upper bound. One failure out of fifteen server-years would give an annual availability of 93.5% for each server.
So, each server's availability is somewhere between 60.6% and 93.5%. That's a pretty wide range, and won't be satisfactory to many people. That's OK, because it reflects our current degree of uncertainty.
To find the overall reliability, I could just take the worst case and plug it in for all three probabilities, then plug in the best case. That slightly overstates the edge cases, though. I'm better off getting Excel to help me run a Monte Carlo analysis to give me an average across a bunch of scenarios. I'll construct a row that randomly samples a scenario from within these ranges. It will pick three values between 60.6% and 93.5% and compute their product. Then, I'll copy that row 10,000 times by dragging it down the sheet. Finally, I'll average out the computed products to get a range for the overall reliability. When I do that, I get a weighted range of 28.9% to 62.6%. [2] [3]
Yep, this single stack web site will be available somewhere between 28.9% of the time and 62.6%. [4]
Actually, it's likely to be worse than that. There are two big problems in the analysis so far. First, we've only accounted for hardware failures, but software failures are a much bigger contributor to downtime. Second, more seriously, the equation for overall reliability assumes that all failures are disjoint. That is, we implicitly assumed that nothing could cause more than one of these servers to fail simultaneously. Talk about Pollyanna! We've got common mode failures all over the place, especially in the network, power, and data center arenas.
Next time, we'll start working toward a more realistic calculation.
1. I'm using a lot of simplifying assumptions right now. Over time, I'll strip these away and replace them with more realistic calculations. For example, a constant failure rate implies an exponential distribution function. It is mathematically convenient, but doesn't represent the effects of aging on moving components like hard drives and fans.
2. You can download the spreadsheet here.
3. These estimation and analysis techniques are from "How to Measure Anything" by Doug Hubbard.
4. Clearly, for a single-threaded stack like this, you can achieve much higher reliability by running all three layers on a single physical host.